
This is the second post in a 3-part series discussing a partnership I initiated between Tulane University, the American Red Cross, and OpenStreetMaps, in which students in my undergraduate IDEV4100: ICT4D course participated in real-world mapping for OpenStreetMaps using satellite imagery, to support development and disaster preparedness initiatives being conducted by the American Red Cross in coordination with local host Red Cross and Red Crescent National Societies.
- Part 1: Introduction
- Part 2: Process and Progress
- Part 3: Outcomes & Reflection
A New Link in the Chain: Tulane Students Generate Maps
I got wind of a ‘mapping party‘the American Red Cross was hosting in August 2012, to jump-start their base maps for Prepare Uganda. The event was held in partnership with Humanitarian Open Street Maps (HOTOSM), who also hosted the data, and little to no previous experience was required on the part of the volunteers. More than 20 volunteers joined the mapping party in person on August 19th and traced streets, paths, parks, and other points of interest from the satellite images into Open Street Maps, a freely editable wiki map. These base maps would then move to the next stage of editing by local volunteer teams on the ground in Uganda using geographic surveys to fill in details like street names and building uses to take the maps to the next level.
The idea of participants needing little to no previous experience was surprising, yet appealing me to. If a one-time event like this with approximately two dozen volunteers could produce a workable product for this kind of project, what might a classroom of university students do in a couple of weeks with some training and support? An idea occurred to me that we might have an opportunity for a “win-win” situation: by partnering with the International Services Department staff at American Red Cross NHQ who were working on the mapping projects, our Tulane students might be able to generate an incredible quantity of base-level mapping work for their OSM project, while at the same time gaining some valuable hands-on learning experience with a real-world technology-based project. It was a new kind of model: a short-term group of crowdmappers with training specific to their project area, focusing on one geographic area, based on a particular need. I contacted the GIS analyst at the American Red Cross who was heading up the project, Robert Banick, and pitched the idea to him. It was an appealing addition from his perspective as well, a somewhat “captive” group of mappers to work on a specific project at a known time. There was an additional space in Braise, Uganda that he and his colleagues in the field were hoping to have a base map available for within the next few months, so students enrolled in the Fall 2012 course offering could fill a definite short-term need for their program.
Just as the Fall 2012 semester was beginning, I quickly modified the course syllabus, adjusted some assignments and timelines in order to accommodate this exciting project opportunity, endeavoring to best match Robert’s needs and schedule as well as the students’ needs and semester schedule. We settled on an “end of semester” project, for late November/early December, to fit Robert’s travel schedule, the needs of the Bwaise local mapping teams, and to give us time to develop our plans for working with the students, while also allowing me to replace the students’ final project for the course with a hands-on OSM learning activity.
Fall 2012
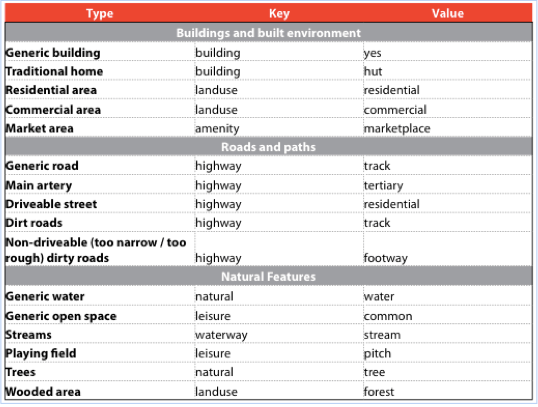
Figure A: Tracing Key from Visual Tracing Guide for Bwaise, Uganda, Fall 2012
The process of going through the OSM activity with the students that first semester was quite challenging, for all parties involved, but it was not without its rewards. We provided the students with the same Visual Tracing Guide that had been given to the volunteers at the summer “mapping party”, developed by the American Red Cross. It was a very simple document, with only four pages of content, three pages of which were simply sample satellite images designed to illustrate the different types of structures and landforms the students would encounter and how to correctly tag them. (See Figures A and B) In retrospect, it provided a great deal less information than we needed to be successful with the students’ mapping efforts that semester. Without written instructions or helpful tips on how to correctly trace the structures and landforms and roads, verbal and written feedback from the students indicated that this led them to feel somewhat unprepared and had a number of questions they felt were unanswered.
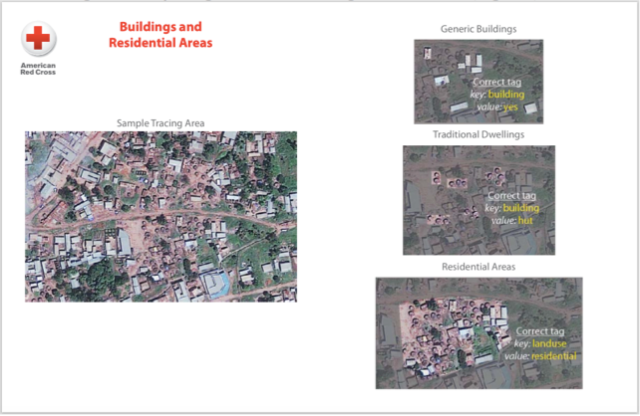
Figure B: Sample Page from Visual Tracing Guide for Bwaise, Uganda, Fall 2012
The first day of the activity was Thursday, November 29, 2012. We used Skype to bring Robert in as a guest speaker for the day’s class session, and introduced the project, walked the students through the background of the OSM activity, including what they would be doing, talked about the JOSM software and how to select their grid squares from the Humanitarian OpenStreetMaps Tasking Server. It proved to be an overwhelming class session, as many students had difficulties with the download and installation processes, which distracted from and delayed the subsequent mapping instructions. Following that class session, I wrote several pages of instructions for the students to follow on how to download, install, and properly adjust the settings for JOSM, as well as how to manage the tasking server, including screen shots and step-by-step instructions. Several other challenges arose over the course of the two-week activity, as students struggled with the software and satellite imagery, understanding the processes of tracing and tagging items on the maps, and dealt with the stress of managing this activity during a very busy time of the fall semester, as finals approached.
As with any pilot project, our outcomes for the first semester were unknown. Neither Robert nor myself was sure what kind of quality and quantity of work to expect; an uncertainty that made the parameters of the assignment and grading of the activity challenging from an instructor perspective. There were several unknowns in terms of how the students would respond to the opportunity, what care they would take with their mapping tasks, whether the motivation of a good grade lead to high quality work for the OSM map, whether the training we provided them was enough to give them the knowledge and confidence to make good decisions about their work, and how the map products themselves could be graded – based somehow on the “quality” of the maps, on the “effort” the students put into their work? The process was a learning experience for the students, for myself and for Robert, but the tangible results were much more clear.
Figure C: OpenStreetMaps View of Bwaise, Uganda After Student Mapping
Figure C illustrates visually what the students that first semester were able to accomplish despite the challenges. Although there are some identifiable gaps, the productivity of their work is evident here. The rectangular area in the center of the map image is the exact boundary of the assigned work area given to the class in their OSM Tasking Manager. It is clearly seen where the students were able to map hundreds of buildings in the town, helping to generate a much more detailed map than what was previously available, and indeed what is still available in adjacent areas. The experience of the project, however, frustrating, also proved to be a positive one for the students in terms of their learning in the course. (See below Discussion on Student Outcomes)
Spring 2013
For our second semester, we made a number of changes to the structure of the OSM activity to try and streamline the process for the students, eliminate some of the major software-related stumbling blocks, and provide better instructions and support up-front so that the students had the information and training they need to hit the ground running and have the confidence to work on their map tasks effectively. First of my list of changes was to shift the activity earlier in the semester, to avoid the “end of the semester” stress and minimize conflicts with major assignments from other courses. We began our Spring 2013 OSM activity, mapping two areas in Indonesia, on Thursday, February 25th. Rather than students coming to class without any preparation, we gave them a video to watch and installation instructions for JOSM in advance, asking them to have completed both before class on the 25th. This allowed us to introduce Robert and give some background, but jump more quickly into the meat of the activity on the first day. I also elected to spread out the activity over a couple of weeks, with other class material in the interim, giving students time to work on their maps over the course of more days, on their own time, rather than cramming into a week’s time. We had two other class sessions specifically focused on the activity, on March 14 and March 21, the first as a mid-point to check in and troubleshoot, an in-class workday for students to ask questions and work collaboratively, and the second as a wrap-up day, to discuss the project’s results, and implications for international development as a whole.
Our Visual Tracing Guide for Indonesia, while still only four pages long, provided some more detail for the students and better guidance so they could refer back to the pages when they had questions about how to identify and tag what they were seeing in the satellite imagery.
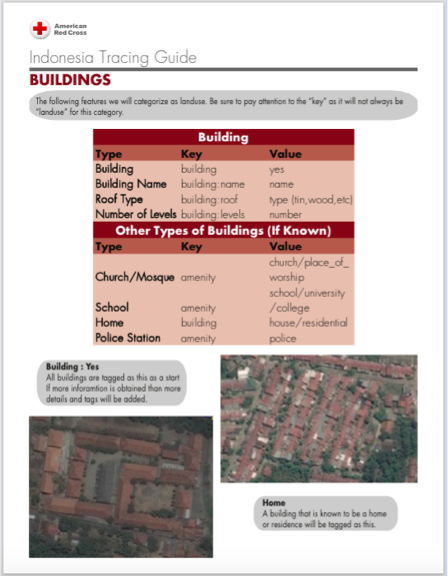
Figure D: Sample Page from Visual Tracing Guide for Indonesia, Spring 2013
There were two other major changes I intended to implement for the activity for the second semester. First, I identified and enlisted the help of a member of the local OSM community, Matthew Toups, to join our class in person to help during the process as an in-house troubleshooter and extra technical support, and to help the students with tips on how to use OSM and JOSM most effectively, but also to give the students access to someone who worked with OSM as a volunteer, to talk about his experiences as a volunteer mapper. Second, I wanted to have access to an actual campus computer lab, a space where all of the students could work on the same computers with the same operating systems; JOSM works more smoothly on Windows-based systems and computers with a mouse, and most of the students came to class with Apple laptops with trackpad, which presented some challenges we could have avoided. Unfortunately there weren’t any computer lab spaces available that would accommodate the 27 students enrolled in the course that semester, and university policy didn’t allow us to download the JOSM software on campus computers anyway, so while my plans for a local OSM troubleshooter panned out, I wasn’t able to achieve my objective of securing a computer lab for us to use for the activity, so students used their own computers once again.
One seemingly minor change that resulted in a much more smooth process for the students to divide up their work was actually assigning grid squares to the students in advance. This also made it easier for me as the instructor to assign specific parts of the map to specific students and be able to grade them accordingly, instead of students randomly choosing parts of the map on their own. I used the OSM Tasking Manager map (see Figure D) as the base and wrote students’ names on the map so they each knew which squares were their responsibility. This helped minimize confusion as to who was to be working on which parts of the map, and minimized overlapping and repetition of work.
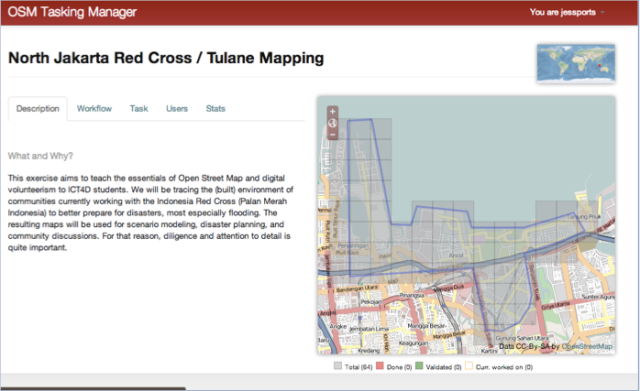
Figure E: OSM Tasking Manager for Spring 2013 North Jakarta Task, Pre-Mapping
Fall 2013
The third semester that Robert and I worked together on this OSM activity with the students went much more smoothly than the previous two. While Matt’s schedule unfortunately didn’t allow him to come back as our in-house OSM troubleshooter again this semester, his absence was mitigated by the fact that by this time I myself had two semesters of experience behind me, and the Fall 2013 IDEV4100 course only had twelve students enrolled, which meant I was able to provide personal attention to each student who had challenges, which I would not have been able to do in a classroom double that size without another person there to assist.
For this semester, we further developed the Visual Tracing Guide for the students to use as reference throughout their work on the project. Robert had an intern in his office at the Red Cross who was able to help him, and by this time the model of short-term mapping activities we had been using with our class was beginning to be replicated in other ways, so a more versatile, in-depth Visual Tracing Guide was becoming necessary. The Fall 2013 Visual Tracing Guide we used for the students who were mapping the Kathmandu Valley in Nepal was now 22 pages in length and included much more detailed instructions, samples for students to see, common error examples, and visuals of menu options they could follow. (see Figure F)
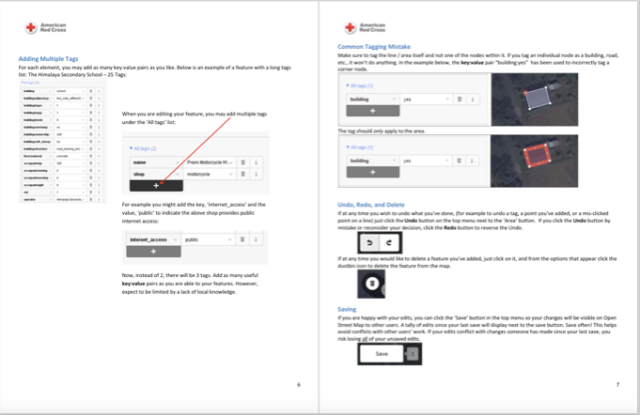
Figure F: Sample Page from Visual Tracing Guide for Tulane, Fall 2013
The biggest change this semester, however, was our software platform. We switched from using JOSM as our mapping editor to using iD Editor, which was an excellent decision that eliminated our software headaches almost entirely. iD Editor is a web-based platform that doesn’t need to be downloaded and isn’t operating-system specific, so it works equally well on Windows and Mac computers, and as students make edits they are changed on the maps instantaneously, rather than students downloading the image file, making all of their edits, and then uploading the file at the end. This means there is less danger of students losing their work from corrupted files or uploading errors, they are able to see their changes on the map right away, they can see how their classmates are mapping things in neighboring grid squares and match up their edits accordingly (i.e. if they are adding a road, they can connect the road directly to the road in the next square).
By this time, as an instructor I was also able to articulate from the start of the project very clearly what the expectations were for the students in terms of what they needed to accomplish for the mapping from the perspective of OSM and Red Cross, vs. what they needed to accomplish in order to successfully complete the assignment and receive an acceptable grade for their work in the course. This had been quite challenging the first semester in particular, but by the third I knew what could reasonably be accomplished in a short amount of time, what volume of work the students were capable of, and what kind of variation I could expect between students of different comfort levels and skill levels. This made assigning and grading the students’ work much easier from an instructor perspective.
By pulling data from each student’s OSM username profile, we can compile limited data to estimate the productivity of the students on average and per semester over the course of our partnership with the Red Cross. Figure G represents a rough estimate of the number of edits made, in total, per semester, measured in thousands of edits. Of course, the number of students changed each semester, which clearly affects these measurements. However, that change alone would not seem to account for the variation in the numbers seen here. In my estimation, the factors most likely to account for these variations by semester would be much more complex than this, involving a number of factors including changes in the number of students enrolled in the course.
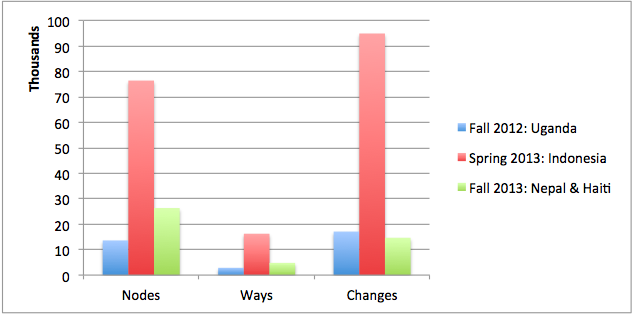
Figure G: Quantity of Edits Made by Students Per Semester, Totals, in Thousands
From Fall 2012 (the first semester, mapping the town of Bwaise in Uganda) to Spring 2013 (the second semester, mapping North Jakarta and Depok in Indonesia):
- After having gone through the process once in the Fall, Robert and I were much better prepared to respond to questions and anticipate problems the second time around. This made getting through the JOSM installation process run more smoothly.
- Matt Toups as our in-house OSM troubleshooter made addressing questions much more effectively and he was able to provide tips like keyboard shortcuts to help students get through their work more efficiently.
- The actual mapping tasks we were given by Robert were MUCH larger. In comparison to the one small area of Bwaise we were working on in the previous fall, this time we had two cities in Indonesia, both VERY densely populated, and buildings much more densely spaced. We simply had more “stuff” to map.
- There were fewer students in the class, only 27 enrolled compared to 37 the previous fall. Fewer students meant we were able to get to each one of them to answer questions more quickly, but also meant they each were assigned a LOT more work. Each student was assigned four full grid squares to work on.
- The activity ran for nearly a full month, from February 25 to March 21, compared to less than ten days the first semester. They were better able to schedule time to work on the project, in their own time, on their own terms, in pairs or in teams, without having to work around final exams at the same time.
- They were highly encouraged to work together, in groups, collaboratively. Bouncing ideas off of each other and getting second opinions on “does this look like a path to you?” turned out to be very beneficial to them as they made decisions about their mapping.
From Spring 2013 (the second semester, mapping North Jakarta and Depok in Indonesia) to Fall 2013 (the third semester, mapping Kathmandu Valley, Nepal, and some areas in Northern Haiti).
- In addition to not having our in-house OSM support in the form of Matt Toups, I was also without a teaching assistant for the first time in a few semesters. While the small class size helped to mitigate this, it also changed how I set up the course in terms of all of the assignments, and did mean there was not one, but two fewer people in the room to help support the students in their work.
- They began the activity working on mapping the Kathmandu Valley in Nepal, but then, due to some more immediate, pressing needs on a project in Haiti, our students were asked to switch mid-stream to some areas in Northern Haiti which needed some attention.
- Once they switched to Haiti, they actually had a great deal of trouble finding “stuff” to map. They didn’t have specifically assigned grid squares in these areas, they just went looking in the areas we spoke about, looking through the satellite imagery for unmapped stuff the way a “normal” mapper would. This was quit different from the way students had begun mapping areas for all of the other OSM activities in class, where they had essentially started with nearly blank slates with perhaps a few roads here and there, and they could just open their grid square and have everything blank and ready to map. In the Haiti tasks, it took a great deal of time and effort for them to look through the existing maps and locate areas to work on, which not only slowed them down and (in terms of the numbers on the chart) made them less productive in overall numbers of edits, but actually frustrated them because they suddenly felt like they weren’t “doing anything” compared to what they had been working on in Nepal.
- For the Haiti maps, an extremely high emphasis was put on quality, the accuracy of the work, and the precision of the tracing, rather than quantity of edits made, because of the more advanced state the maps were already in when they got to them. This added an extra measure of pressure and tracing things took some extra time, which slowed the students down a bit as well.
If you look at the numbers arranged a bit differently, in terms of the average work done per student, it supports some of these ideas, though further research needs to be done in order to determine qualitatively the significance of the variables. Figure H shows the numbers of nodes and ways created per student, on average, by semester, and so somewhat reflects the average amount of work done by a student in each of the three semesters.
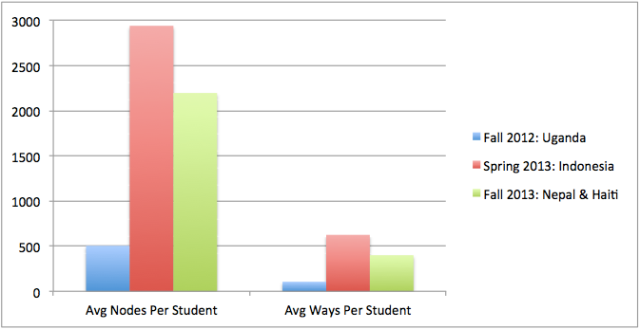
Figure H: Quantity of Nodes & Ways, Average Per Student, Per Semester
Over the course of all three semesters, these students made over 125,000 edits to the maps in these four countries. In fact, more data than this was actually added or changed, as these numbers only reflect the ones I was able to track. This doesn’t include some of the data that was sent directly to Robert at the Red Cross, mostly student .osm files that had problems, which he added directly after making adjustments and correcting issues. That includes files for at least ten students from the first semester, and additional student files here and there in both the second and third semesters.
READ MORE in the third and final post in this series: Outcomes & Reflections
